Bitcoin On-Chain Analytics at Odds With Sub-$8K Bitcoin Price Forecasts
At the start of February, the cryptocurrency market was doing fairly well with many altcoins pressing above their 2-year old descending trendlines and breaking above the 200-day moving average on astonishingly high volume surges that provided investors with double and triple-digit returns on a nearly daily basis.
By Feb. 13, Bitcoin (BTC) was trading at $10,500 and bullish analysts forecasted that any day the $11,000 and $11,500 resistance levels would be obliterated, opening the door for a swift return to the $12K zone. Even as Bitcoin price rejected at $10,400 and pulled back to $9,500 investor sentiment remained bullish as many analysts believed a retest of $9,400 was inevitable.
All of this changed with the arrival of the coronavirus. Formally known as COVID-19, the virus had been making news headlines since late December 2019 but the last two weeks saw the fear of contagion spread to global markets as investors began to ponder the worst-case scenarios in which the spread of the virus could impact economic productivity.
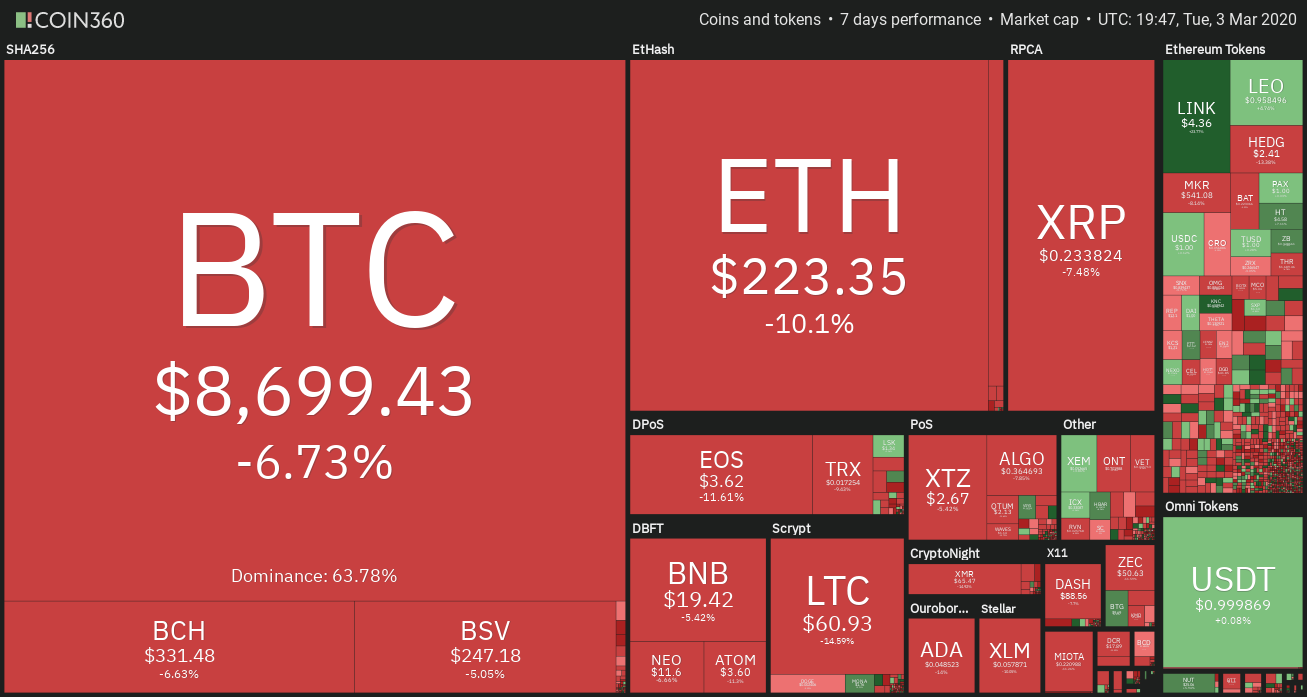
Crypto market 1-week price chart. Source: Coin360
As extensively covered by Cointelegraph, global markets and cryptocurrency prices imploded last week, wiping $3.6 trillion in value from the stock market and $48 billion from the crypto market. Bitcoin price dropped by $1,500 in just one week and analysts now fear the digital asset could revisit the $7K zone if global markets continue to plummet.
What does on-chain activity say about Bitcoin?
Investors relying on standard technical analysis have likely adopted a bearish point of view on Bitcoin’s short-term price. But what does Bitcoin’s on-chain activity say about the current state of the market’s largest digital asset?
To gain a deeper understanding of this, Cointelegraph spoke with glassnode co-founder Jan Happel about a variety of blockchain metrics and how they can inform investors about the current and future state of Bitcoin price.
Cointelegraph: Bitcoin price closed last week down by $1,500 and investor sentiment has taken a bearish turn according to the Crypto Fear & Greed Index. Does Bitcoin’s on-chain data also provide the same point of view?
Jan Happel: Generally, the sentiment among long term Bitcoin investors seems to be positive right now. The Bitcoin ASOL (Average Spent Output Lifespan) is a metric that shows the average age (in days) of spent transaction outputs.
As long as ASOL stays low, we don’t have to worry that long term holders are trying to move and sell their coins. Consecutive weeks of spikes in this metric can be alarming– historically this was observable during times of large selloffs.
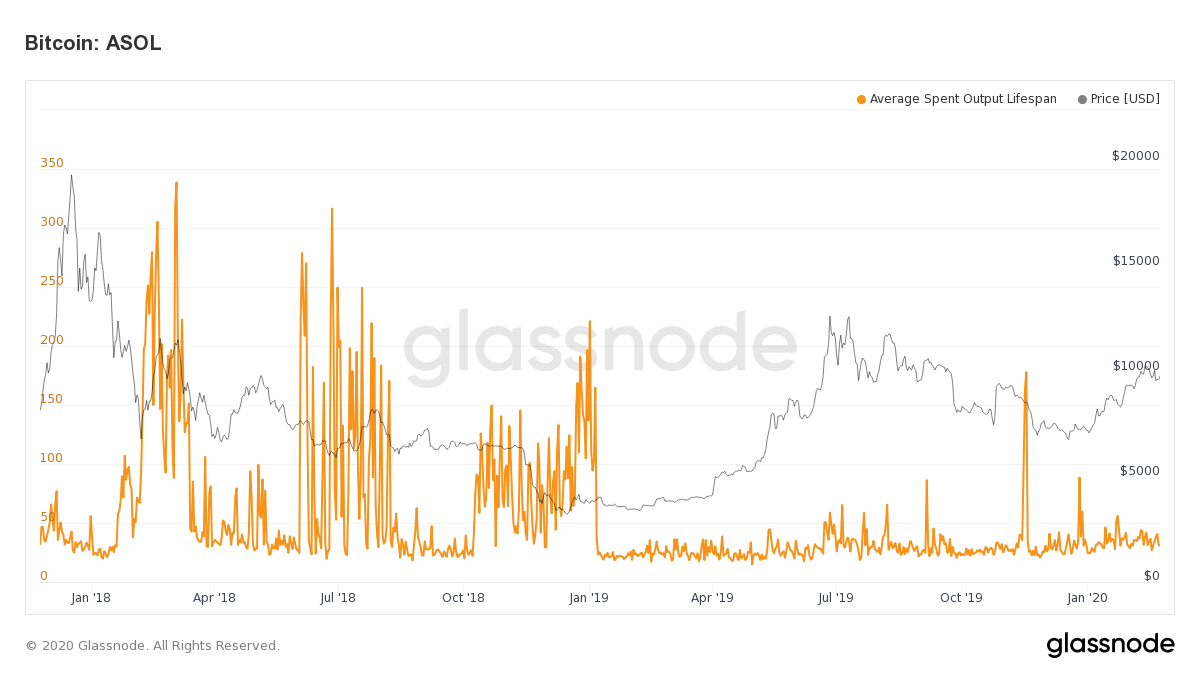
Bitcoin ASOL. Source: glassnode.com
CT: What about last week’s massive sell-off and price drop? Does this mean Bitcoin investors are leaving the market?
JH: Not necessarily, the Bitcoin HODL waves chart shows that the number of Bitcoins that haven’t moved for more than 2 years is still increasing, which is a further sign that more investors are holding their coins than just a year ago.
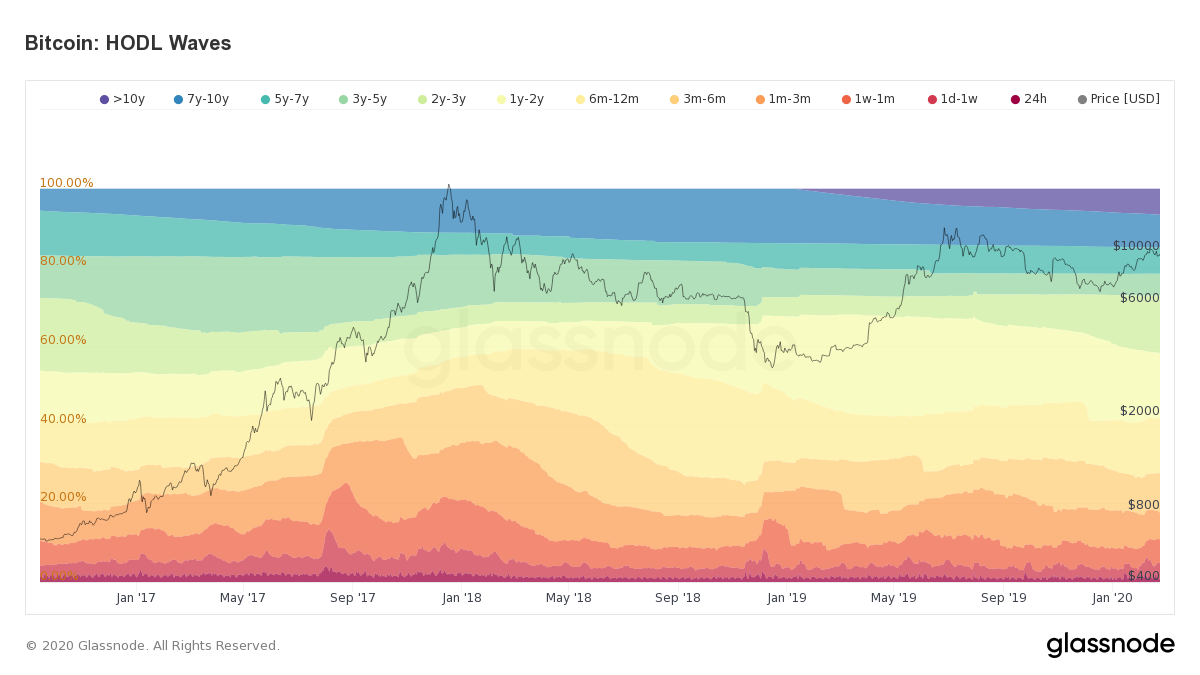
Bitcoin HODL Waves. Source: glassnode.com
Furthermore, unrealized profits are at a healthy level and show no sign of the market having topped right now. Historically this indicator was very good at catching the tops and an overvalued market- currently, it is at a level similar to where it was at the beginning of past bull markets.
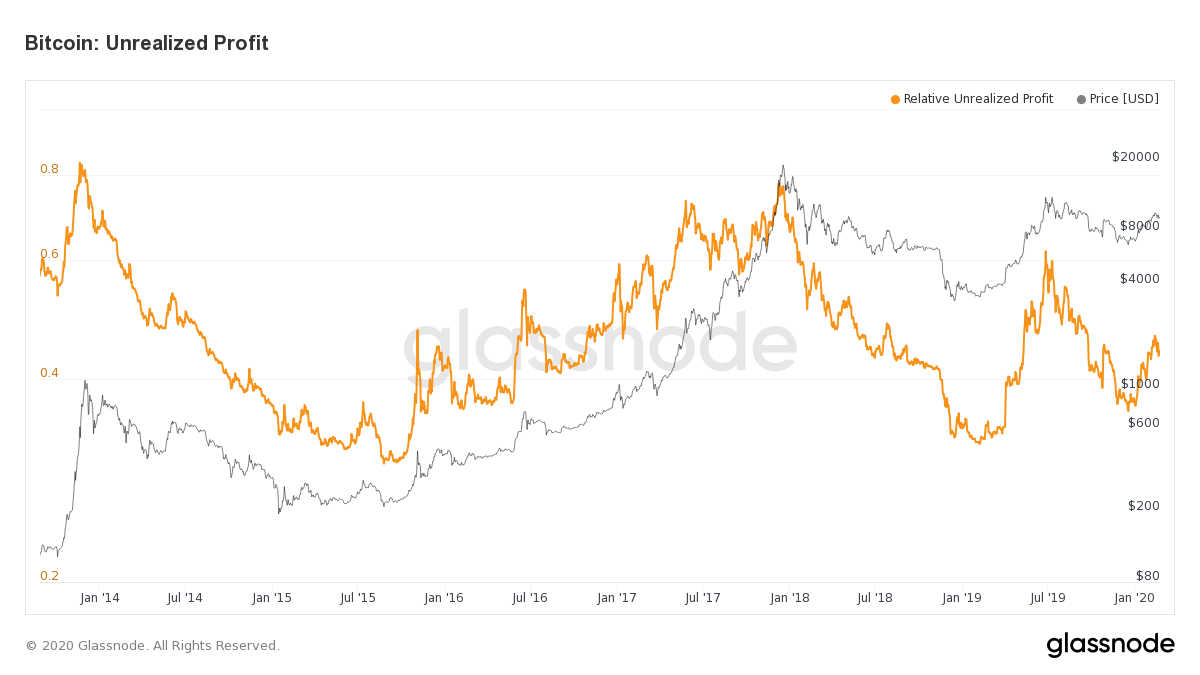 Bitcoin Unrealized Profit. Source: glassnode.com
CT: Throughout late 2018 and the majority of 2019 media reported almost weekly that various aspects of the Bitcoin network had reached new all-time highs. What does on-chain data tell us today about actual activity on the Bitcoin network?
JH: Network activity and growth are recovering from last year. For instance, entity adjusted transaction counts are trending upwards again. These are essentially the total number of transactions between different entities but it does not include transactions that occur within addresses of the same entity.
The number of addresses with non-zero balances is also reaching new all-time highs each week.
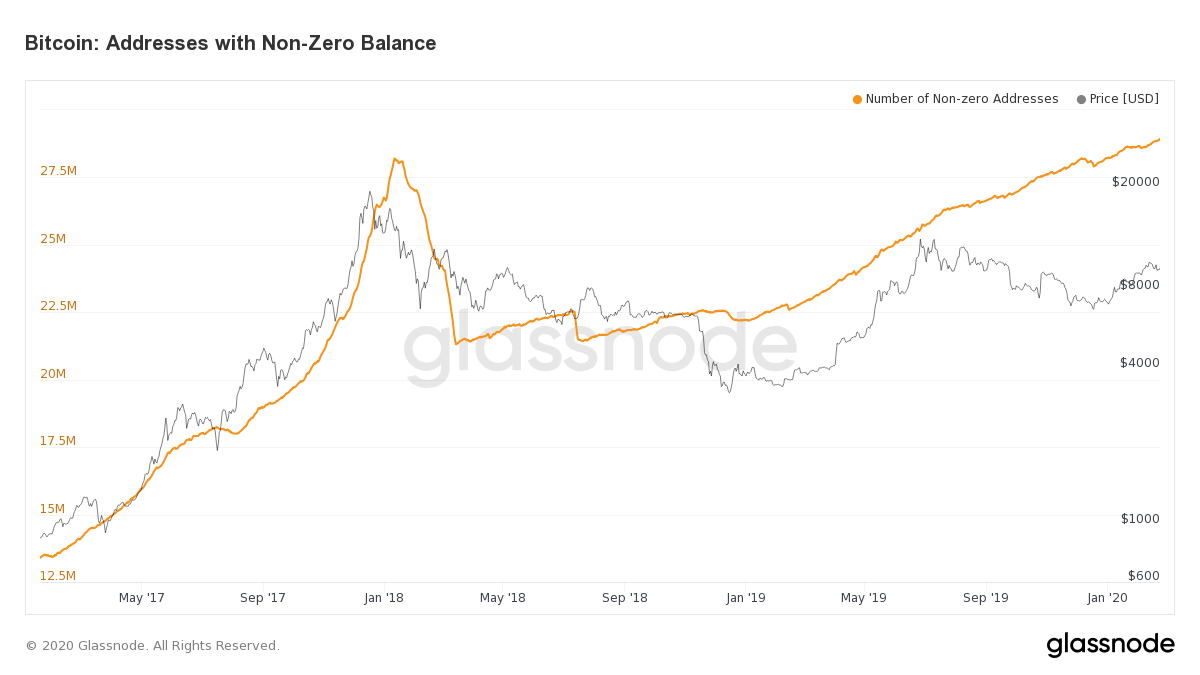 Bitcoin Addresses with Non-Zero Balance. Source: glassnode.com
Our R&D team recently discovered that over 75% of Bitcoin’s on-chain volume doesn’t change hands. In fact, a recent glassnode report states that:
“On-chain data is without a doubt highly valuable–but in its raw form, it’s just not good enough. It contains a substantial amount of noise, and careful preprocessing and contextualization is required in order to distill useful information from it.”
The views and opinions expressed here are solely those of the author and do not necessarily reflect the views of Cointelegraph. Every investment and trading move involves risk. You should conduct your own research when making a decision.


